

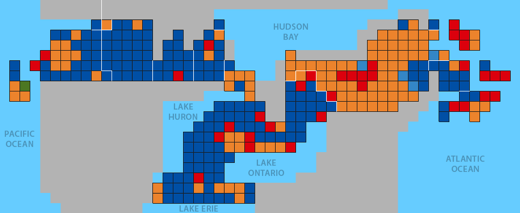
I wrote recently about creating a “cartogram” of Canada, where each political riding in the House of Commons is represented by a square. Such a map emphasizes population over geography to show how, for example, Ontario and Quebec together make up almost two-thirds of the country. And for elections, a cartogram makes it much easier to see the results for the whole country at once without completely losing the geographic frame of reference.
The original map was a static image I created to show the breakdown by political party. When it came time to update it after the results of the federal election on May 2, I decided to get a little fancier and make a more dynamic, interactive version. Without further ado then, I present electoralcartogram.ca, which shows the ridings by party for both before and after the election. It also includes an animation mode to switch back and forth, seat totals for each party, and a way to filter to see only one party at a time. I also corrected some mistakes: a couple ridings were spelled wrong, and two ridings had the wrong colour — St. John’s South should have been NDP, not Liberal, and Brossard—La Prairie should have been Liberal, not BQ.
The election of course was an astonishing event that not only brought the Conservatives the majority they sought, but all but obliterated the Liberals and the Bloc, while promoting the NDP to the Official Opposition thanks to an “orange tide” in Quebec.
The before and after view clearly reveals just how the Conservatives won their majority. Going into the election, the Liberals had a solid base of seats in Toronto and the surrounding suburbs. What we see now is how the NDP attacked the Liberals from Central Toronto, while the Conservatives attacked them from the rim. Formerly Liberal suburbs of Toronto — Mississauga, Brampton, Richmond Hill, Ajax, Pickering — all turned blue, and so did many ridings in the outer part of the city of Toronto — North York, Scarborough and Etobicoke. And that’s all it took, really. The NDP also picked up a seat in Scarborough and won four new seats in central Toronto from the Liberals, and of course the NDP wiped out the Bloc in Quebec. But nothing outside Ontario really influenced the Conservative majority. Nothing outside Greater Toronto really did in fact. The Conservatives won only two more seats outside Ontario in 2011 as they did in 2008 (−1 in BC, −4 in Quebec, +2 in Manitoba, +2 in New Brunswick, +1 in Nova Scotia, Newfoundland and Yukon). And only three new seats in Ontario came from outside the Greater Toronto Area (London North Centre, Sault Ste. Marie and Nipissing—Timisaking).
3 Comments